Tree
Top 100 Documentaries App with React Hooks and Material-UI
Overview
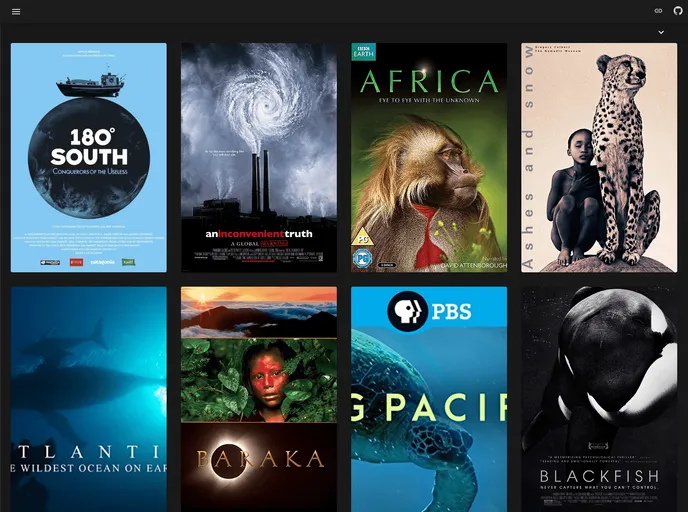
The Top 100 Documentaries App is built using Create React App and Material-UI. This application focuses on providing a curated list of top documentaries for users to explore. The project structure, state management using React Hooks, lazy loading components and routes, and performance optimization are key aspects of this application.
Features
- Project structure: Well-organized and structured files for easy maintenance.
- State Management: Utilizes React Hooks for simplifying state and lifecycle management in function components.
- Lazy Loading: Implements React.lazy function for dynamic import of components and routes.
- Component Routes: Efficient management of routes for seamless navigation.
- Performance: Optimized performance through techniques like code-splitting and lazy loading.
- Reference: Provides helpful resources for understanding React Hooks and global state management.
Summary
The Top 100 Documentaries App leverages Create React App and Material-UI to showcase a user-friendly interface for exploring top documentaries. With its emphasis on project structure, state management with React Hooks, lazy loading, and performance optimization, this application provides an excellent example of a modern, responsive web application built with React.
- React

React is a widely used JavaScript library for building user interfaces and single-page applications. It follows a component-based architecture and uses a virtual DOM to efficiently update and render UI components
- Material UI

material-ui adds classes to Tailwind CSS for all common UI components. Classes like btn, card, etc. This allows us to focus on important things instead of making basic elements for every project.
- Recharts

Recharts is a powerful and easy-to-use React library for building customizable and interactive charts. Built on D3.js, it offers a wide range of pre-built chart types, such as line, bar, pie, and scatter charts, all of which can be composed with a declarative syntax.