Mkdocs Charts Plugin
Mkdocs plugin to add plots from data using vegalite
Overview
The mkdocs-charts-plugin offers an innovative way to create and visualize data charts directly within your MkDocs documentation. Leveraging the declarative VegaLite syntax, this plugin simplifies the process of integrating dynamic reports into your documentation, allowing for greater ease in creating reproducible analyses. Whether you're presenting your research findings or technical data, this plugin enhances the appeal and functionality of your documentation.
What sets mkdocs-charts-plugin apart is its support for popular themes, such as mkdocs-material, which provides features like instant loading and a user-friendly dark mode. Whether you're a seasoned developer or just starting your documentation journey, this tool can significantly elevate the value of your project's documentation.
Features
- VegaLite Integration: Easily incorporate any valid VegaLite JSON into your markdown files for advanced visualizations.
- Data Source Flexibility: Visualize data directly from .json or .csv files, streamlining the inclusion of complex datasets.
- Thematic Support: Fully compatible with mkdocs-material themes, including instant loading capabilities and dark color themes for an enhanced user experience.
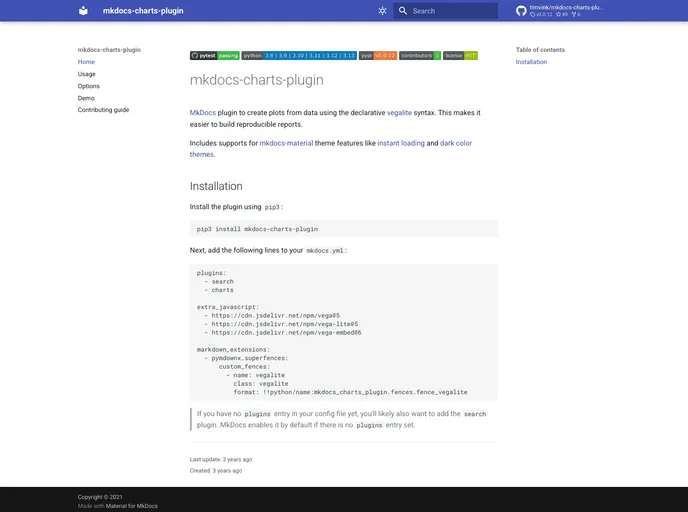
- Simple Installation: Easily install the plugin using pip3 and configure it by adding a few lines to your mkdocs.yml file.
- Extensive Documentation: Access a wide array of examples, use cases, and options through comprehensive documentation.
- Community Resources: Explore additional charting plugins tailored to meet diverse specific use cases within your MkDocs environment.
- MkDocs

MkDocs is a fast, simple and downright gorgeous static site generator that's geared towards building project documentation. Documentation source files are written in Markdown, and configured with a single YAML configuration file.