React Native Responsive Linechart
A customizable and responsive line or area chart for react-native
Overview
The React Native Responsive Linechart is an exceptional tool for developers looking to create visually appealing and responsive line or area charts within their mobile applications. It caters especially to those using React Native, allowing for a streamlined integration that enhances data visualization without compromising on performance. This charting library is versatile, making it suitable for various applications ranging from simple displays to more complex visual data representations.
With its customizable features, the React Native Responsive Linechart empowers developers to tailor their charts to fit their specific needs. This flexibility ensures that whatever data you need to display, it can be done in an engaging and informative manner that enhances user interaction.
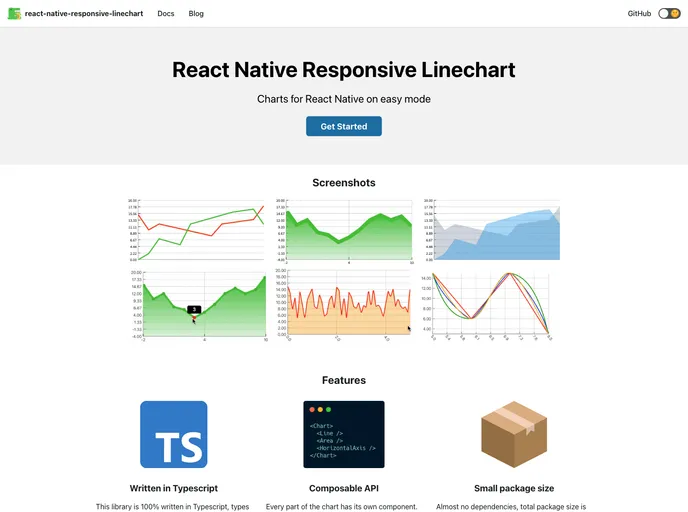
Features
- Customizable Designs: Easily modify the aesthetics of your charts, including colors, line styles, and labels for a unique look that fits your app's theme.
- Responsive Layouts: Automatically adjusts to different screen sizes, ensuring clarity and usability across all devices, be it smartphones or tablets.
- Interactive Elements: Includes features like tooltips and touch events that allow users to engage with the data more intuitively.
- Data Handling: Efficiently manages and visualizes a wide range of data sets, making it suitable for both small and large datasets.
- Easy Integration: Seamlessly integrates with existing React Native applications, allowing you to enhance your data visualization without extensive rework.
- Supports Multiple Data Formats: Compatible with various data sources and formats, facilitating a smoother data flow into the charts.
- Performance Optimization: Designed to maintain high performance even with complex datasets, ensuring that your app runs smoothly.