Tailwindcss Team Management
A team management dashboard template with tailwindcss
Overview
If you're looking for a sleek and responsive solution for managing your team, the TailwindCSS Team Management Template could be just what you need. Designed with TailwindCSS, this template offers a modern aesthetic while ensuring functionality for effective team collaboration. Whether you're a developer, project manager, or part of a creative team, this dashboard can enhance productivity and streamline workflow.
This template not only stands out for its design but also offers a comprehensive set of features that cater to various team management needs. Its ease of installation and compatibility with modern web technologies makes it an attractive option for teams looking to improve their management processes.
Features
- Responsive Design: Adapts seamlessly to different screen sizes, ensuring accessibility on desktops, tablets, and mobile devices.
- TailwindCSS Integration: Built with TailwindCSS for a consistent and customizable design experience.
- Node.js Compatibility: Easily integrates with Node.js for backend functionality, making it suitable for various tech stacks.
- Real-Time Updates: Supports real-time data updates, keeping everyone on the same page and enhancing communication.
- User-Friendly Interface: Intuitive layout allows users to navigate with ease, minimizing the learning curve for new team members.
- Customizable Styles: TailwindCSS makes it simple to adjust the styles according to your brand's identity.
- Development Ready: Comes prepared for easy installation and development with npm and Tailwind CLI, allowing teams to start quickly.
- Tailwind

Tailwind CSS is a utility-first CSS framework that provides pre-defined classes for building responsive and customizable user interfaces.
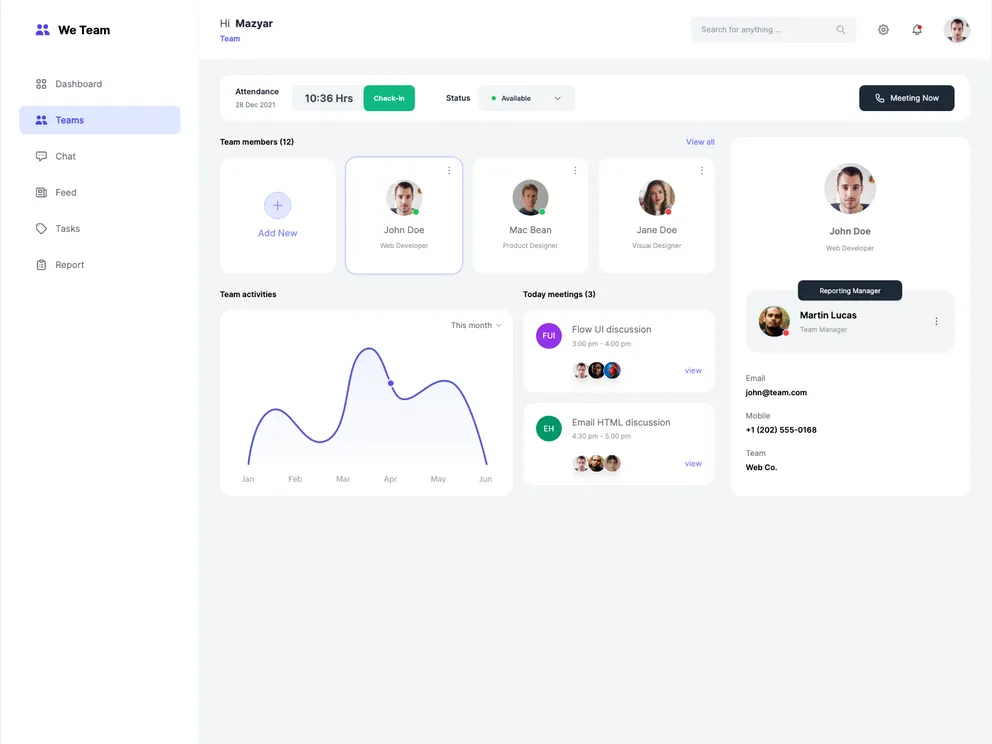
- Dashboard

A dashboard style website template is a pre-designed layout that features a user interface resembling a control panel or dashboard. It typically includes charts, graphs, tables, and other data visualization tools that allow users to monitor and analyze data in real-time.