Angular D3 Graph Example
[Example Project] Angular 2 with D3 interactive graph
Overview
Angular D3 Graph is an innovative approach to integrating powerful visualization capabilities into Angular applications. Developed using angular-cli version 1.0.0-beta.26, this example illustrates how to create dynamic and interactive graphs using the D3.js library within an Angular framework. This project serves as a valuable resource for developers looking to leverage data visualization in their web applications, showcasing the seamless blend of Angular's component-based architecture with D3's robust graphing features.
Features
- Easy Setup: Quickly get started with the project using angular-cli, ensuring a smooth initial setup process.
- Real-time Data Visualization: The app automatically updates when source files are changed, allowing developers to see real-time changes in their data visualizations.
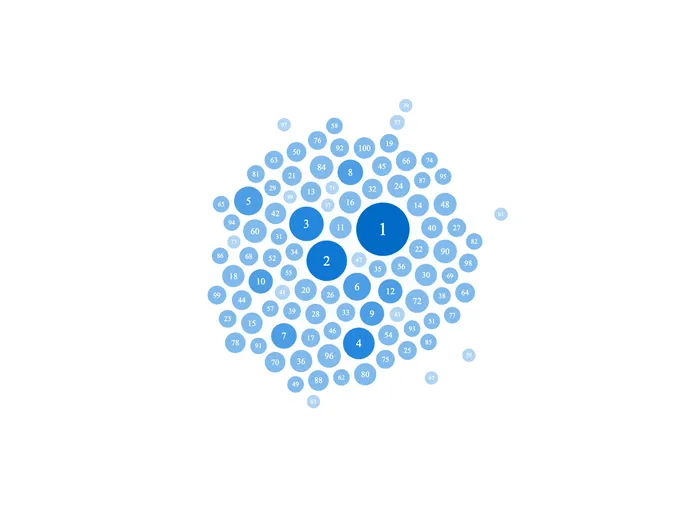
- Integration with D3.js: Leverage the powerful capabilities of D3 to create beautiful, interactive graphs and charts within Angular applications.
- Component-based Architecture: Benefit from Angular's architecture to maintain a clean and organized codebase while developing data visualization projects.
- Local Development Server: Use the built-in
ng servecommand to run a local development server and view your application in a browser. - Responsive Design: Design graphs that adapt to different screen sizes, enhancing usability across devices.
- Tutorial Guidance: A simple tutorial accompanies the example, making it accessible for developers of varying experience levels.
- Typescript

TypeScript is a superset of JavaScript, providing optional static typing, classes, interfaces, and other features that help developers write more maintainable and scalable code. TypeScript's static typing system can catch errors at compile-time, making it easier to build and maintain large applications.