Qwikcrud
An AI-powered command-line tool that generates REST APIs and admin interfaces based on one line requirement
Overview
qwikcrud is an innovative command-line tool that simplifies backend development by automating the creation of REST APIs and admin interfaces. Designed to streamline the tedious process of writing CRUD endpoints, it enables developers to focus on core business logic rather than repetitive tasks. Particularly beneficial for those starting new projects, qwikcrud offers a range of features that enhance development speed and efficiency.
While qwikcrud has impressive capabilities, it's important to note that the generated application is not production-ready out of the box. Additional steps are required to ensure a secure and fully functional environment, making it crucial for developers to be prepared for some extra setup to make it suitable for live use.
Features
- Rapid API Generation: Quickly create RESTful APIs and admin interfaces without writing repetitive code, saving valuable time in the development process.
- Backend Framework Support: Currently supports FastAPI and SQLAlchemy, with plans for additional frameworks in the future.
- Environment Variable Configuration: Easy setup with essential environment variables, allowing for smooth integration with Google and OpenAI for application generation.
- Cost-Effective Usage: Generates applications with minimal API costs, including a free tier for Google and inexpensive options for OpenAI.
- Future-Ready Roadmap: Continuous improvement with planned features like authentication options and support for more frameworks and AI providers.
- Community Contributions: Open for contributions, encouraging users to share improvements and enhancements to the tool.
- Comprehensive Technology Stack: Leverages advanced technologies including FastAPI, SQLAlchemy, and Pydantic to ensure robust and efficient application performance.
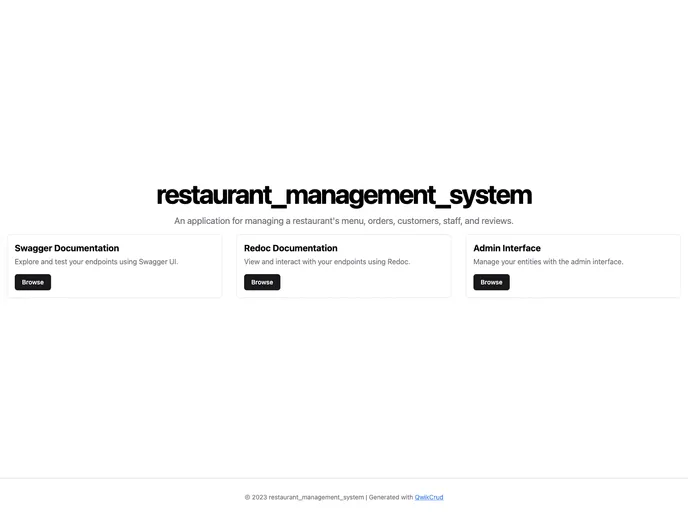
- Dashboard

A dashboard style website template is a pre-designed layout that features a user interface resembling a control panel or dashboard. It typically includes charts, graphs, tables, and other data visualization tools that allow users to monitor and analyze data in real-time.