Frame
:bulb: A user system API starter
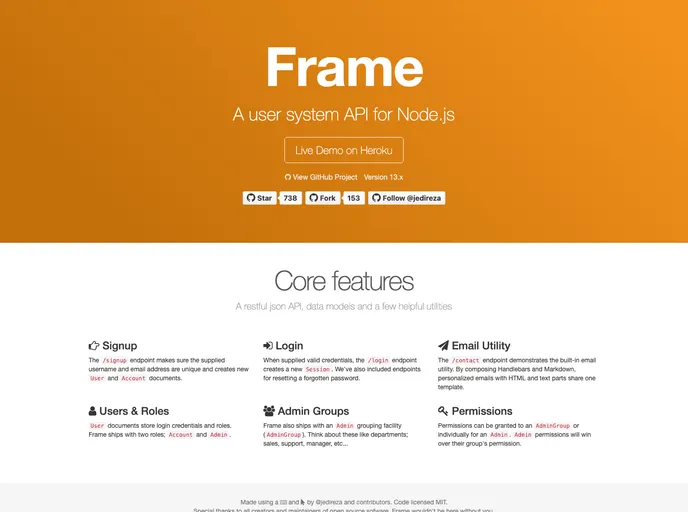
Overview
Frame is an innovative user system API starter designed to streamline backend development by providing a solid foundation for building robust applications. It offers a variety of essential features that cater to both standard users and administrators, allowing developers the freedom to create their own front-end experiences. Despite being archived, the project reflects a thoughtful approach to API design and user management, making it a valuable resource for anyone venturing into API development.
Although Frame is not actively maintained, it leverages powerful technologies like the hapi framework and MongoDB, ensuring a stable and efficient environment for crafting applications. The ease of setup, combined with the rich feature set, sets a positive tone for developers who wish to build upon or learn from this project.
Features
- User Authentication: Built-in login system supports forgot password and reset password functionalities, streamlining user access management.
- Security Measures: Abusive login attempt detection adds an essential layer of security to protect user accounts.
- Role Management: User roles for accounts and admins simplify the management of varying levels of access within the application.
- Administrative Tools: Admin-only notes and status history for accounts provide transparency and management ease for administrators.
- Permission Groups: Admin groups with shared permissions enhance collaboration and control over user access settings.
- Flexible Framework: Frame is designed as a RESTful JSON API, promoting flexibility to develop a custom front-end or integrate existing solutions.
- Environment Configuration: Utilizes confidence for easy management of configuration settings across different environments, enhancing deployment practicality.
- Dashboard

A dashboard style website template is a pre-designed layout that features a user interface resembling a control panel or dashboard. It typically includes charts, graphs, tables, and other data visualization tools that allow users to monitor and analyze data in real-time.