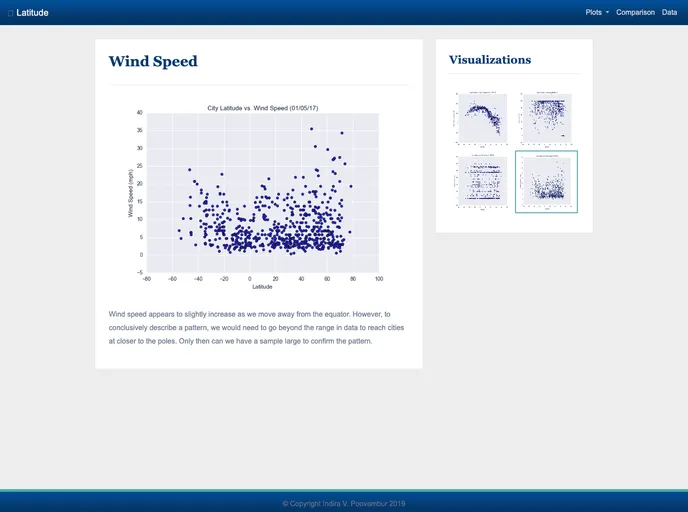
Responsive Visualization Dashboard
Built using Bootstrap4, CSS3, HTML5 and themed using Booswatch, this responsive dashboard analyzes weather data of 500 world cities gathered by making CityPi API and OpenWeatherMap API calls. Data is plotted into multiple charts using MatplotLib.