Ng2 Google Charts
Angular Google Charts module
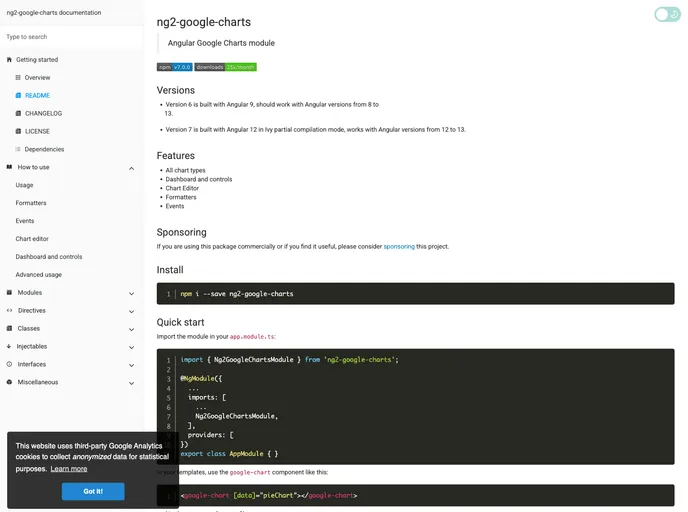
Overview:
The ng2-google-charts is a module for Angular that allows users to easily integrate Google Charts into their applications. With versions compatible from Angular 8 to 13, it offers a range of features such as various chart types, dashboard and controls, chart editor, formatters, and events. Users also have the option to sponsor the project as a way to support its development.
Features:
- All chart types: Supports various types of charts for data visualization.
- Dashboard and controls: Provides options for creating dashboards with interactive controls.
- Chart Editor: Allows users to edit charts to customize their visuals.
- Formatters: Offers formatting options for data displayed on the charts.
- Events: Enables the implementation of event handlers for user interactions.
Summary:
The ng2-google-charts module is a versatile tool for integrating Google Charts into Angular applications. With support for a range of chart types, interactive features like dashboard controls and chart editing, and event handling capabilities, users can create rich visualizations with ease. Additionally, the option to sponsor the project provides a way for users to contribute to its ongoing development and support.
- Angular

Angular is a TypeScript-based open-source framework by Google for building dynamic single-page applications and cross-platform mobile apps with MVC architecture and a rich set of features.
- Typescript

TypeScript is a superset of JavaScript, providing optional static typing, classes, interfaces, and other features that help developers write more maintainable and scalable code. TypeScript's static typing system can catch errors at compile-time, making it easier to build and maintain large applications.