Angular2 Calendar Heatmap
Angular component for d3.js calendar heatmap graph
Overview
The Angular component for D3.js Calendar Heatmap is an innovative tool for visualizing time series data, making it ideal for tracking activity over the past year. This component not only displays the overarching patterns and trends but also allows for an in-depth look at specific days with just a click. Inspired by the popular GitHub contribution graph, this heatmap brings practicality and aesthetic to your data visualization needs.
By offering various levels of detail — from global overviews spanning multiple years to focused daily insights — this component caters to a wide array of user requirements. Whether you're analyzing personal time management or team contributions, the ease of integration with Angular makes it a valuable addition to any project's toolset.
Features
- Global Overview: Provides a high-level view of multiple years of data, summarizing trends at a glance.
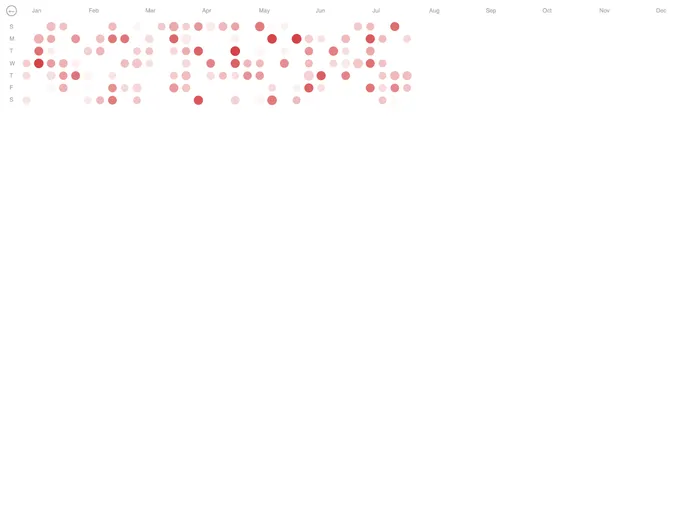
- Year Overview: Dive deeper into yearly data with the ability to easily zoom in for specifics.
- Month Overview: Visualize monthly activity to identify patterns over time and enhance time tracking.
- Week Overview: Get a closer look at weekly data, helping to manage productivity and task completion.
- Day Overview: Offers detailed insights into each day's tracked time with hover-over tooltips for quick information.
- Customizable Themes: Utilize a hex color theme to personalize the heatmap’s appearance to fit your project's design.
- Optimized Tooltip Summary: For days with extensive data, a summarized view helps maintain clarity without overwhelming the user.
- Easy Integration: Seamlessly install via npm and incorporate into your Angular project with minimal fuss.
- Angular

Angular is a TypeScript-based open-source framework by Google for building dynamic single-page applications and cross-platform mobile apps with MVC architecture and a rich set of features.
- Rollup

RollupJS is a popular and efficient JavaScript module bundler that takes the code from multiple modules and packages them into a single optimized file, minimizing the overall size of the application and improving its performance.
- Typescript

TypeScript is a superset of JavaScript, providing optional static typing, classes, interfaces, and other features that help developers write more maintainable and scalable code. TypeScript's static typing system can catch errors at compile-time, making it easier to build and maintain large applications.