Basic Template Prime Vue Nuxt
This project integrates a basic dashboard responsive template in the Nuxtjs framework based on PrimeVue UI components
Overview
The Basic Template Prime Vue Nuxt is a robust solution for developers looking to implement a responsive dashboard using the Nuxt.js framework. By leveraging PrimeVue UI components, this project streamlines the process of creating visually appealing and functional web applications. Ideal for those prioritizing efficient layout and design, it offers a solid foundation for further customizations and enhancements.
Features
-
Responsive Design: The template is built with a mobile-first approach, ensuring an optimal viewing experience across various devices, from desktops to smartphones.
-
PrimeVue Components: Incorporates a wide range of customizable UI components from the PrimeVue library, allowing for a cohesive and modern design.
-
Nuxt.js Integration: Seamlessly integrates with the Nuxt.js framework, providing server-side rendering and enhanced performance for better user experience.
-
Easy Customization: The template is structured for ease of use, making it simple for developers to modify and expand upon the existing components to meet specific project needs.
-
Powerful Dashboard: Designed for displaying dynamic data, the template includes features typical of dashboard interfaces, making data visualization straightforward and intuitive.
-
Pre-built Layouts: Comes with several pre-configured layouts that cater to various use cases, saving time and effort during the development process.
-
Community Support: Being rooted in popular technologies like Nuxt.js and PrimeVue means that there is a strong community backing, providing resources and assistance when needed.
- Nuxt

nuxt.js is a lightweight and flexible JavaScript framework that allows developers to easily build dynamic and reactive user interfaces. Its intuitive syntax, modular architecture, and focus on performance make it a popular choice for modern web development.
- Dashboard

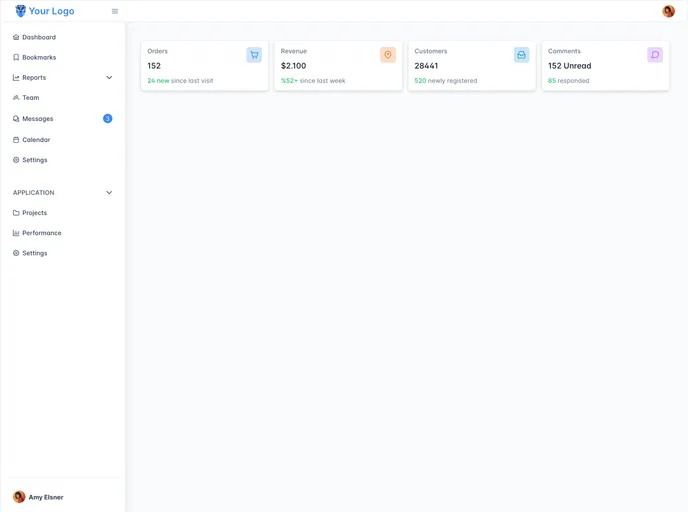
A dashboard style website template is a pre-designed layout that features a user interface resembling a control panel or dashboard. It typically includes charts, graphs, tables, and other data visualization tools that allow users to monitor and analyze data in real-time.