Myheroku
Heroku app for a visualization dashboard
Overview:
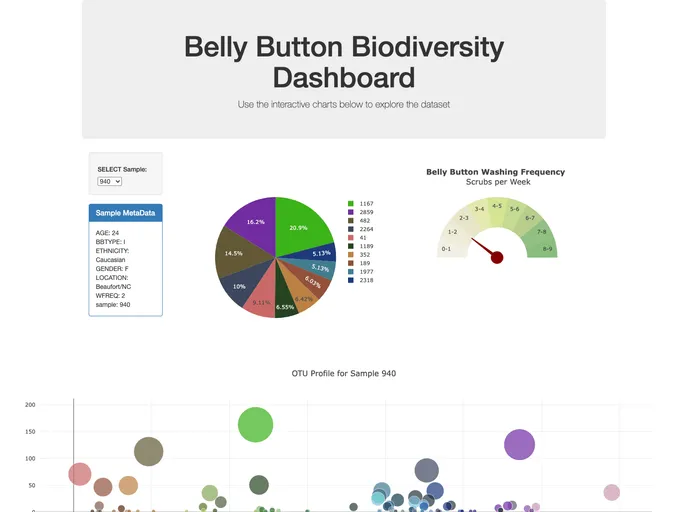
The repository on Heroku is a dashboard used to explore the data from the "Belly Button Biodiversity DataSet". It includes graphs built using the Plot.ly library and utilizes Flask for GET/POST methods, SQLAlchemy for connecting to and querying the database of samples, JavaScript (D3) to respond to menu changes and update the contents of the dashboard, and Plot.ly to generate the plots. The dashboard is deployed as an app on Heroku.
Features:
- Graphs with Unique Color Scheme: Each otu_id is assigned a unique color using a function in the file color-scheme.js. This allows the colors to remain constant between the plots and samples.
- Empty Plots for No Observations: If there are no observations recorded for a sample, the pie chart and bubble plot will be empty. This is a result of using let declarations instead of var statements in the functions in app.js.
- Interactivity with Menu Changes: The dashboard is responsive to menu changes, updating the contents of the dashboard accordingly.
Summary:
The Heroku dashboard repository provides a user-friendly interface to explore the data from the Belly Button Biodiversity DataSet. With its unique color scheme for each otu_id and interactive menu changes, users can easily analyze and visualize the dataset using the provided graphs. The installation process is straightforward and allows for easy deployment of the app on Heroku.