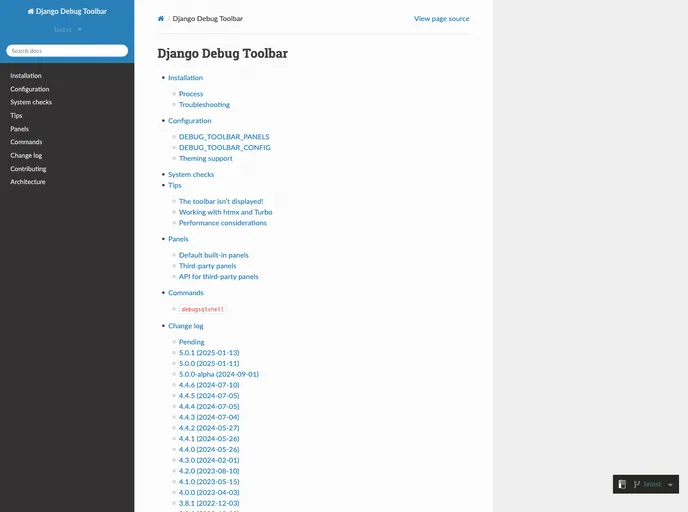
Django Debug Toolbar

A configurable set of panels that display various debug information about the current request/response.
Overview
The Django Debug Toolbar is an essential tool for developers working with Django applications. It offers a set of customizable panels that display vital debug information related to the current request and response cycle. This allows developers to gain deeper insights into the performance and behavior of their applications, making troubleshooting and optimization much easier.
With its user-friendly interface and extensive configuration options, the Django Debug Toolbar can significantly enhance the development experience. By providing real-time data on various aspects of your application, it empowers developers to quickly identify and resolve issues, ensuring a smoother and more efficient workflow.
Features
- Configurable Panels: Customize the toolbar to display only the information you need, optimizing your debugging process.
- Real-time Information: Access live data about your requests and responses, allowing you to spot issues as they occur.
- Performance Metrics: View detailed performance statistics to identify bottlenecks in your application and improve response times.
- SQL Query Inspection: Examine the SQL queries generated by your Django views to optimize database interactions and reduce overhead.
- Cache Information: Gain insights into cache usage and performance, helping you to make informed decisions about caching strategies.
- Signal Monitoring: Track signals fired during request processing, which can help in debugging complex interactions within your application.
- Request Context: Access detailed information about the current request, including headers, cookies, and session data, for comprehensive troubleshooting.
- Debugging History: Keep a history of requests, making it easy to trace issues across different sessions and interactions.
