Cdbreact Admin Template
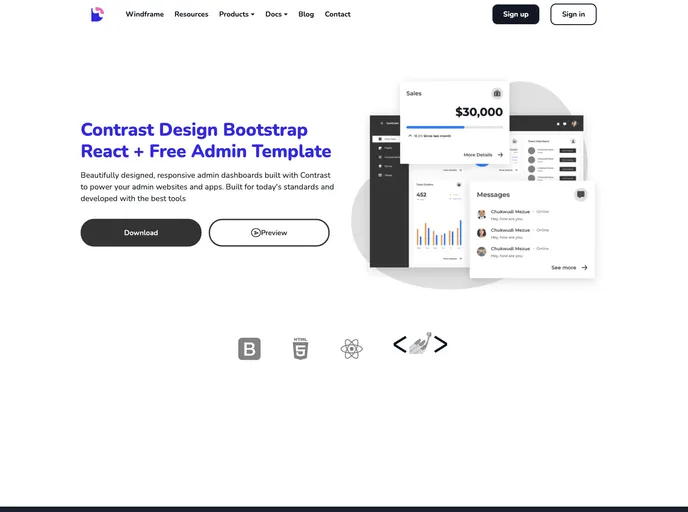
Beautifully designed, responsive admin dashboards to power your admin websites and apps. Built with today's standards and developed with the best tools
Overview
The Contrast React Admin Dashboard is a free project that utilizes the CDBReact Package by Devwares. It is designed to provide a user-friendly interface for managing and controlling various aspects of a web application. This dashboard supports multiple browsers and offers documentation for easy implementation. Additionally, there is a Pro Version available with additional features and licensing options.
Features
- User-friendly interface: The Contrast React Admin Dashboard provides a visually appealing and intuitive interface for managing web applications.
- Browser support: This dashboard supports various browsers, including IE/Edge, Firefox, Chrome, Safari, and Opera.
- Documentation: Devwares offers detailed documentation to guide users in implementing and customizing the Contrast React Admin Dashboard.
- Pro Version: There is a Pro Version available with additional features and licensing options.
Summary
In summary, the Contrast React Admin Dashboard by Devwares is a free project that provides a user-friendly interface for managing web applications. It offers browser support, detailed documentation, and a Pro Version with additional features. To install the dashboard, users need to clone or download the CDBReact package and integrate it into their project.
- React

React is a widely used JavaScript library for building user interfaces and single-page applications. It follows a component-based architecture and uses a virtual DOM to efficiently update and render UI components
- Bootstrap

Bootstrap is the most popular CSS Framework for developing responsive and mobile-first websites.
- Dashboard

A dashboard style website template is a pre-designed layout that features a user interface resembling a control panel or dashboard. It typically includes charts, graphs, tables, and other data visualization tools that allow users to monitor and analyze data in real-time.