Know Ais
KnowAIS project won first place and Best Visualization in The UN Big Data Hackathon 2022 Big Data Expert Track.
Overview
The KnowAIS project emerged victorious at the UN Big Data Hackathon 2022, securing first place and Best Visualization in the Big Data Expert Track. This innovative self-service analytics platform is designed specifically for optimizing the global shipping network by leveraging vast amounts of Automatic Identification System (AIS) data to generate crucial insights and support decision-making. The application not only demonstrates the power of big data in enhancing shipping operations but also highlights the collaborative efforts of a talented team from various organizations, including BPS - Statistics Indonesia and Tokopedia.
KnowAIS aims to facilitate the processing of AIS data quickly and effectively, with a focus on the relationship between global shipping networks and essential statistical indicators of the world economy. By utilizing a structured approach in data filtration, analysis, and visualization, KnowAIS provides an invaluable resource for stakeholders in the shipping industry.
Features
-
Real-Time Insight Generation: Enable leaders to make informed decisions by quickly processing and visualizing AIS data in real-time.
-
Comprehensive Data Analysis: Conduct thorough analysis connecting global shipping networks with economic statistical indicators, fostering a deeper understanding of market dynamics.
-
Efficient Data Filtration: Implement an initial filtration process that ensures the most relevant information is captured, streamlining data handling.
-
Robust Sampling Techniques: Maintain high vessel coverage greater than 80% during data sampling, ensuring representativeness and relevance for analysis.
-
Advanced Port Activity Identification: Enhance efficiency by joining AIS data with port activity data using innovative approaches that reduce reliance on complex coordinate systems.
-
Geospatial Analytics: Utilize H3 indexing for trajectory identification across specified zones, facilitating clear insights into maritime patterns and activities.
-
Historical Data Contextualization: Leverage historical data from 1990 to 2018 for comprehensive comparisons and trend analysis, enhancing the accuracy of current assessments.
-
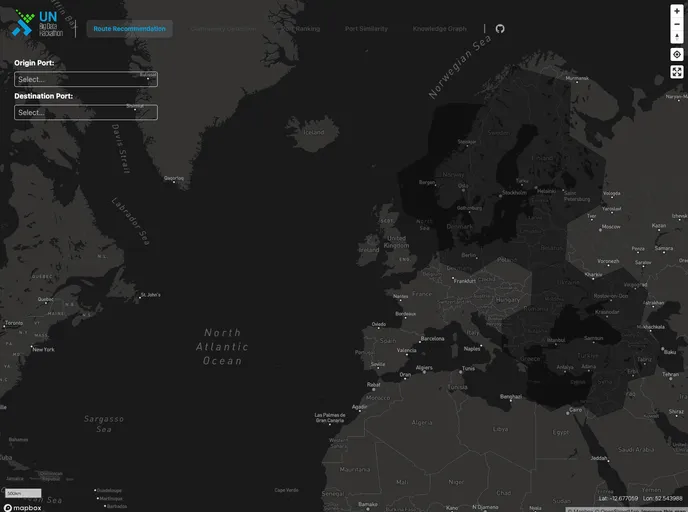
User-Friendly Visualization: Provide intuitive visual representations of data to aid comprehension and facilitate better presentations of findings to stakeholders.
- Solid

SolidJS is a declarative JavaScript library for building user interfaces, offering a reactive programming model for efficient updates. It stands out for its reactivity system that minimizes unnecessary re-renders and its small bundle size, making it a performant choice for developing lightweight and reactive web applications.