Dashboard_UI_Template
Developed demo frontend.
Overview
This repository contains the code for the Dashboard, a web template developed as part of a frontend test for a company. The dashboard provides various features, including a Profile Dashboard, Create New Graph Page, Graph Details Page, Account Settings, and a Pricing page. The application is built using TypeScript, React, and Tailwind CSS.
Features
-
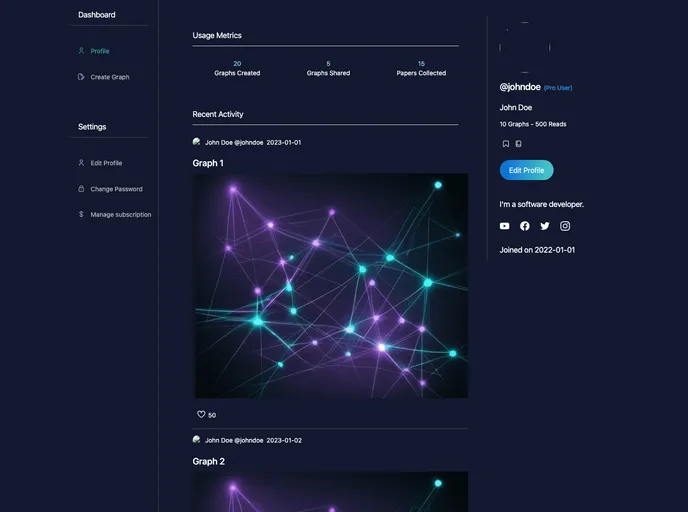
Profile Dashboard: User profile details such as name, email, profile photo, and bio are displayed. Account details including the current subscription plan and status, as well as usage metrics such as graphs created, graphs shared, and papers collected are also shown. A recent activity feed showing recent graphs, collections, and queries is included. Links to Favourites and Collections pages are available.
-
Create New Graph Page: Users can fill out a form to specify graph title and description. They can also upload papers and view a graph visualization preview.
-
Graph Details Page: This page displays the graph's title, description, and date created. Users can click on a button to view the graph and see a list of papers shown in the graph. There are also buttons to edit (remove/favourite papers), share, or delete the graph.
-
Account Settings: Users can update their profile details, change their password, and manage their subscription plan. They also have the option to link third-party accounts like Google.
-
Pricing Page: This page displays the pricing plans for the application. It uses a responsive grid layout with three pricing plan cards.
Summary
The Genoshi Dashboard is a web template that offers various features to manage user profiles, create and view graphs, and customize account settings. It is built using TypeScript, React, and Tailwind CSS. With its intuitive interface and responsive design, the Genoshi Dashboard provides users with a seamless experience for organizing and visualizing data.