Dygraphs
Interactive visualizations of time series using JavaScript and the HTML canvas tag
Overview:
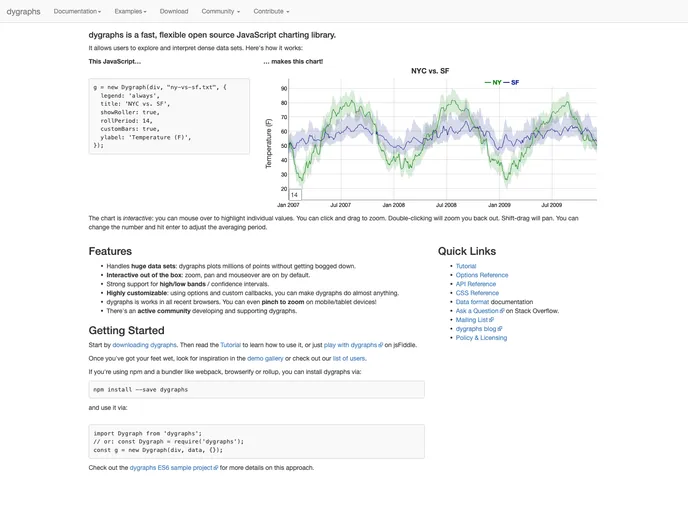
The dygraphs JavaScript library is a tool for creating interactive and zoomable charts of time series data. It provides features such as plotting time series without external servers or Flash, support for error bands around data series, interactive pan and zoom, and more. Dygraphs is compatible with the Google Visualization API and offers extensive customization options. It can be easily installed from NPM and used with module loaders like browserify or webpack.
Features:
- Plots time series without using an external server or Flash
- Supports error bands around data series
- Interactive pan and zoom
- Displays values on mouseover
- Adjustable averaging period
- Extensive set of options for customization
- Compatible with the Google Visualization API
Summary:
Dygraphs is a JavaScript library for creating interactive time series charts easily. It offers a wide range of features like zooming, error bands, and customization options. Its compatibility with the Google Visualization API and ease of installation make it a great choice for developers working with time series data.