D3
Bring data to life with SVG, Canvas and HTML. :bar_chart::chart_with_upwards_trend::tada:
Overview
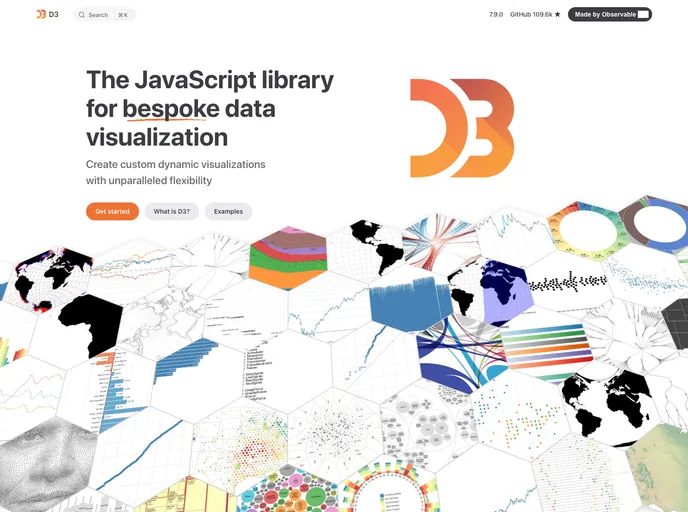
D3 (or D3.js) is an open-source JavaScript library designed for data visualization. It offers flexibility in creating dynamic graphics through its low-level approach based on web standards. Over the years, D3 has been instrumental in creating innovative visualizations, empowering other chart libraries, and fostering a global community of data professionals.
Features
- Free and Open-Source: D3 is freely available and offers its source code for unlimited customization.
- Low-Level Approach: Allows for precise control and flexibility in creating data-driven graphics.
- Web Standards: Built on web standards for seamless integration with existing web technologies.
- Groundbreaking Visualizations: Powering award-winning visualizations for over a decade.
- Community Support: Fosters a vibrant community of data practitioners globally.
Summary
D3, or D3.js, stands out as a powerful tool for data visualization with its low-level approach and adherence to web standards. Its features like flexibility, community support, and innovative capabilities make it a go-to choice for developers and data practitioners looking to create dynamic and engaging graphics. By following the installation guide, users can easily incorporate D3 into their projects and leverage its vast potential for creating data-driven visualizations.
- Vitepress

VitePress is a static site generator designed for creating documentation websites. It offers a lightweight and fast development experience using Vue.js and Markdown, with features such as live-reload, theming, and customizable layout components.
- Eslint

ESLint is a linter for JavaScript that analyzes code to detect and report on potential problems and errors, as well as enforce consistent code style and best practices, helping developers to write cleaner, more maintainable code.
- Rollup

RollupJS is a popular and efficient JavaScript module bundler that takes the code from multiple modules and packages them into a single optimized file, minimizing the overall size of the application and improving its performance.