Awesome Tools
Open-source list of awesome data visualization tools (e.g., charting libraries) for software developers
Overview
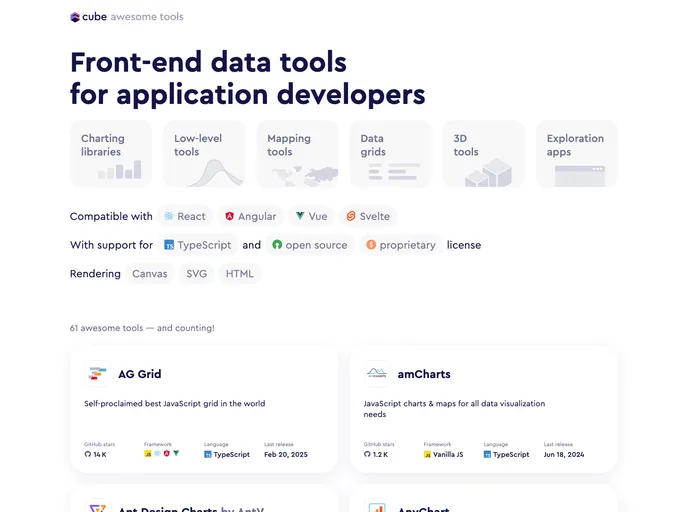
Awesome Tools is a comprehensive open-source collection tailored for software developers who are looking to enhance their projects with data visualization. With an abundance of charting libraries and tools at your fingertips, this resource makes it easier to implement eye-catching and functional visual data displays. It's a fantastic asset for anyone aiming to amplify their data storytelling through visually appealing graphics.
The list not only categorizes various tools but also provides insightful metadata to help developers make informed choices. Whether you're building a complex data dashboard or just need a simple chart for your project, Awesome Tools is designed to meet the diverse needs of developers at all levels.
Features
- Open Source: Freely accessible and customizable, allowing developers to contribute and adapt tools to their specific needs.
- Diverse Range: Includes various types of data visualization tools, catering to different project requirements and preferences.
- User-Friendly: Designed to be intuitive, ensuring that even developers new to data visualization can navigate and utilize the tools effectively.
- Community Contributions: Features tools and libraries recommended by the community, ensuring you get the best and most popular options.
- Regular Updates: The list is continuously updated, providing access to the latest tools and innovations in data visualization.
- Comprehensive Metadata: Each entry comes with metadata that aids in quick comparisons and informed decision-making.
- Cross-Platform Compatibility: Supports a range of platforms, making it versatile for different development environments.
- Angular

Angular is a TypeScript-based open-source framework by Google for building dynamic single-page applications and cross-platform mobile apps with MVC architecture and a rich set of features.
- React

React is a widely used JavaScript library for building user interfaces and single-page applications. It follows a component-based architecture and uses a virtual DOM to efficiently update and render UI components
- Vue

Vue.js is a lightweight and flexible JavaScript framework that allows developers to easily build dynamic and reactive user interfaces. Its intuitive syntax, modular architecture, and focus on performance make it a popular choice for modern web development.