Dashboard Chart
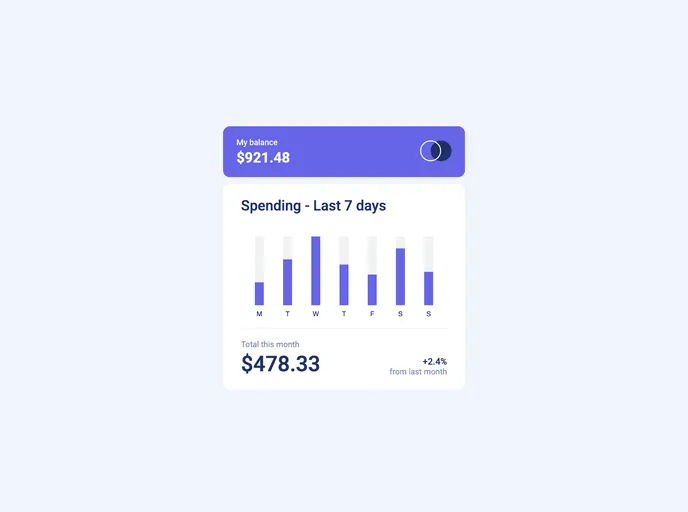
Dashboard chart build using HTML, CSS, and JavaScript.
Overview
The Dashboard Chart project presents a visually appealing and interactive way to represent data, using a combination of HTML, CSS, and JavaScript. It can be particularly useful for developers looking to enhance their web projects with dynamic charts. By understanding how this dashboard functions and its capabilities, users can effectively display information in an engaging manner.
This project not only offers a way to visualize data but also encourages collaboration and community engagement through platforms like GitHub and social media. The simplicity of its setup allows users with basic coding knowledge to implement it easily into their projects.
Features
-
GitHub Repository Insights: Understand the popularity of the project through stats such as repo size, stars, and forks.
-
Web Integration: Built with HTML, CSS, and JavaScript making it easy to integrate into any web application.
-
Live Demo Available: Users can interact with a live demonstration of the dashboard to get a feel of its capabilities.
-
Cross-Platform Compatibility: The project can be run on different operating systems, including Linux, macOS, and Windows.
-
User-friendly Setup: Simple command-line instructions for local installation ensure that even beginners can get started with ease.
-
Community Support: Users can connect through social media platforms, allowing for easy collaboration and help.
-
No Licensing Constraints: The project is free to use with no licensing requirements, making it accessible to everyone.