Apexcharts.js
Interactive JavaScript Charts built on SVG
Overview
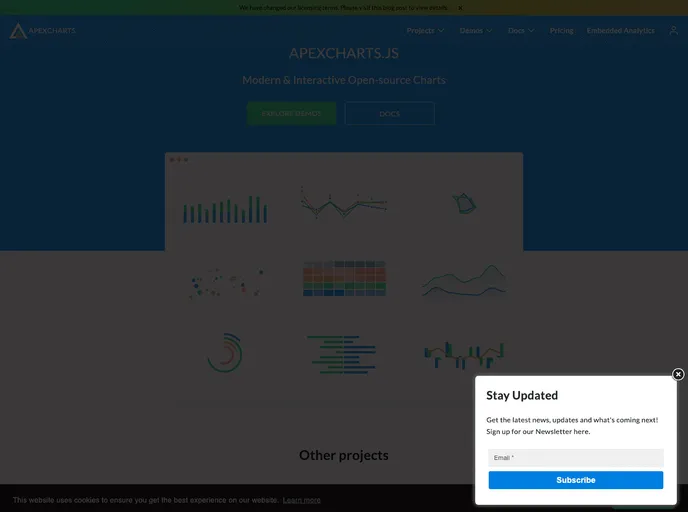
Apexcharts.js is a powerful JavaScript charting library that leverages SVG to create interactive and visually appealing charts. Designed for developers looking to enhance their web applications with dynamic data visualizations, it provides a robust framework to make data interpretation easier and more engaging. With its versatility and ease of use, Apexcharts.js has become a go-to option for creating various types of charts, including line, bar, area, and pie charts.
The library focuses on both aesthetics and performance, ensuring that charts not only look good but also perform smoothly across different devices. Whether you are building dashboards, reports, or any data-driven application, Apexcharts.js is equipped to help you convey information effectively and attractively.
Features
-
Interactive Charts: Users can interact with charts through tooltips and animations, making data exploration intuitive.
-
Responsive Design: Charts automatically adjust to different screen sizes, ensuring optimal viewing experiences on desktops and mobile devices.
-
Variety of Chart Types: Offers a wide range of chart types including line, bar, area, donut, and more, catering to diverse visualization needs.
-
Customization Options: Provides extensive options for customization, allowing developers to tailor the appearance and behavior of charts to fit their projects.
-
Data-Driven: Integrates seamlessly with dynamic data sources, enabling real-time updates and interactions.
-
Documentation and Community Support: Boasts comprehensive documentation and an active community, making it easy for developers to find solutions and share ideas.