Vue Chartkick
Create beautiful JavaScript charts with one line of Vue
Overview:
Vue Chartkick is a tool that enables users to create elegant JavaScript charts with just one line of Vue code. The platform supports popular charting libraries like Chart.js, Google Charts, and Highcharts, offering users flexibility in chart creation. With features such as data visualization options, reactivity, and support for multiple chart types, Vue Chartkick simplifies the process of integrating dynamic charts into Vue applications.
Features:
- Easy Integration: Create stunning charts with minimal Vue code.
- Support for Multiple Libraries: Compatible with Chart.js, Google Charts, and Highcharts.
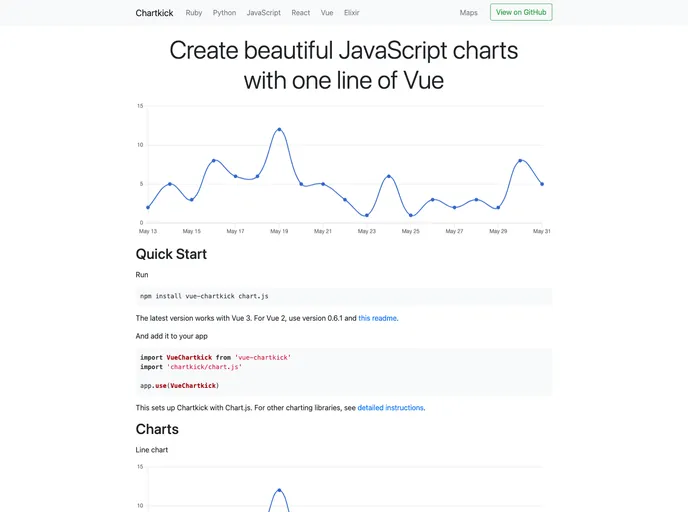
- Various Chart Types: Line, pie, column, bar, area, scatter, geo, and timeline charts available.
- Customization Options: Set colors, legends, prefixes, suffixes, and more for tailored chart display.
- Reactivity: Ensures efficient updates and renders without unnecessary re-renders.
- Multiple Series Management: Manage multiple series effortlessly with advanced options.
- Downloadable Charts: Enable users to download charts directly from the browser.
- Global Options: Set default chart options across all charts for consistency.
Chart.js:
- Run
npm install vue-chartkick chart.js - Add
import Chartkick from 'vue-chartkick'andimport Chart from 'chart.js'to your app.
Google Charts:
- Run
npm install vue-chartkick - Add
import VueChartkick from 'vue-chartkick'andimport 'vue-chartkick/google'to your app.
Highcharts:
- Run
npm install vue-chartkick highcharts - Add
import VueChartkick from 'vue-chartkick'andimport Highcharts from 'highcharts'to your app.
Summary:
Vue Chartkick provides a user-friendly approach to generating interactive charts in Vue applications. With its support for various chart types, customization options, and easy installation process for different charting libraries, Vue Chartkick streamlines the chart creation process for developers. This tool's reactivity, multiple series management, and global options feature further enhance its usability, making it a valuable asset for Vue developers looking to incorporate dynamic data visualization in their projects.
- Rollup

RollupJS is a popular and efficient JavaScript module bundler that takes the code from multiple modules and packages them into a single optimized file, minimizing the overall size of the application and improving its performance.