UI Chart
This directive lets you use jqPlot with Angular
Overview
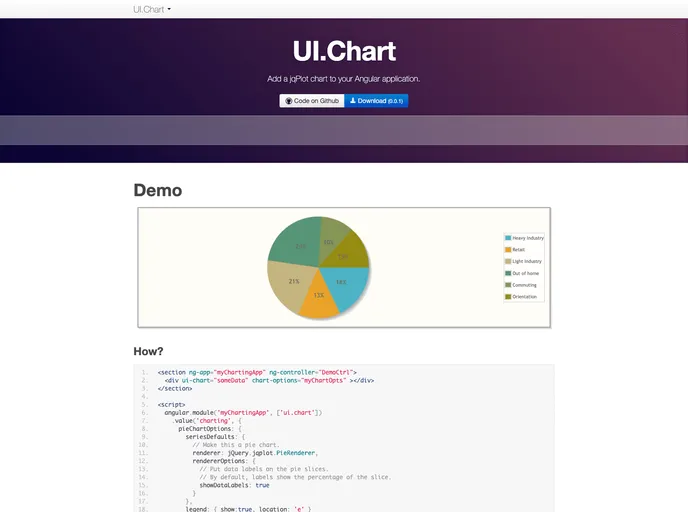
The ui-chart directive is a powerful tool for developers looking to enhance their AngularJS applications with visually appealing and interactive jqPlot graphs. By seamlessly integrating with AngularJS, jQuery, and jqPlot, this directive simplifies the process of adding dynamic charts to your UI, allowing users to visualize data effectively. With its straightforward setup and extensive support for various chart options, the ui-chart directive stands out as an invaluable resource for building data-driven applications.
Features
-
Seamless Integration: Easily incorporates jqPlot graphs into AngularJS applications, allowing for smooth data representation without hassle.
-
Dependency Management: Utilizes Bower for managing dependencies, streamlining the process of maintaining required libraries and plugins.
-
Flexible Usage: Supports the application of the directive as an element, attribute, class, or comment, providing developers with various ways to implement it based on their needs.
-
Dynamic Data Binding: Automatically evaluates the data passed to the jqPlot chart, ensuring that your graphs reflect real-time changes in your application’s state.
-
Comprehensive Option Support: Compatible with any jqPlot chart options, offering extensive customization capabilities for tailored chart designs to meet specific requirements.
-
Quality Assurance: Built with testing in mind, using tools like Karma and JSHint to maintain high code quality—a vital aspect for developers looking to deliver reliable applications.
-
Easy Setup: Following the initial setup steps, the directive allows for quick deployment, enabling developers to focus on functionality rather than configuration complexities.
- Grunt

Grunt is a popular JavaScript task runner that automates repetitive tasks like minification, compilation, and testing, allowing developers to focus on writing code.