Powerbi Report Component
Easily embed your Microsoft PowerBI Report, Dashbord or Tile in your React App
Overview
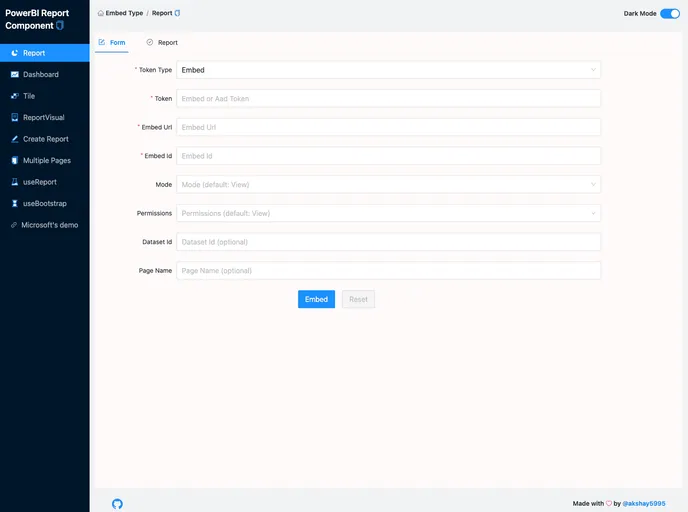
PowerBI Report Component offers a seamless way to integrate Microsoft PowerBI reports, dashboards, or tiles directly into your React applications. This capability not only enhances the visual appeal of your app but also provides data-driven insights in a user-friendly manner. With its straightforward implementation, developers can effortlessly embed powerful analytical tools that help in making informed decisions.
Features
- Easy Integration: This component allows developers to effortlessly embed PowerBI reports into their React applications, reducing setup time and enhancing workflow efficiency.
- Dynamic Content: Users can display real-time dashboards and tiles, making data visualization more interactive and up-to-date.
- Customizable Layout: The component offers flexibility in layout and styling, allowing developers to tailor the appearance to fit the design of their applications.
- User Authentication Support: It includes support for embedding PowerBI reports that require user authentication, ensuring secure access to data.
- Performance Optimization: The component is designed to maintain high performance while rendering complex reports, ensuring a smooth user experience.
- Cross-Platform Compatibility: It works seamlessly across different devices and platforms, ensuring consistent accessibility for all users.
- Interactive Capabilities: Users can interact with reports directly within the app, providing a richer experience through drill-downs and filtering options.
- React

React is a widely used JavaScript library for building user interfaces and single-page applications. It follows a component-based architecture and uses a virtual DOM to efficiently update and render UI components
- Dashboard

A dashboard style website template is a pre-designed layout that features a user interface resembling a control panel or dashboard. It typically includes charts, graphs, tables, and other data visualization tools that allow users to monitor and analyze data in real-time.